by tradespeopleinsights | Feb 3, 2016 | Uncategorized
By Miles Free of PMPA. This post originally appears on pmpaspeakingofprecision.com and is reposted with permission.
Today our growth is limited by our inability to acquire skilled workers. In the last recession, we were held back by lack of demand for our customer’s end products. Today, we cannot find the skilled people that we require to operate new high tech equipment that is needed to make the high precision parts we produce.
Our shops are tackling this issue in a number of ways. Some are setting up internal training programs, some apprenticeships. Several of our member companies are creating on-site schools to teach skills needed. As an industry we helped to create, and are supporting initiatives like Right Skills Now. Right Skills Now uses National Institute for Metalworking Skills (NIMS) credentials to create the skilled workforce that manufacturers require to remain competitive in today’s global markets.
Claim: The President had this to say about employment and manufacturing:
“More than 14 million new jobs; the strongest two years of job growth since the ’90s; an unemployment rate cut in half. Our auto industry just had its best year ever. Manufacturing has created nearly 900,000 new jobs in the past six years. And we’ve done all this while cutting our deficits by almost three-quarters. We’ve launched next-generation manufacturing hubs, and online tools that give an entrepreneur everything he or she needs to start a business in a single day.”
Response: We haven’t won this one yet.
“…there has been a gain of 878,000 jobs since February 2010. But Bureau of Labor Statistics data show that the number of manufacturing jobs is still 230,000 fewer than…in the depths of the recession — and 1.4 million fewer than when the recession began in December 2007. Indeed, the United States only gained 30,000 manufacturing jobs in all of 2015.” – Washington Post
Question: Why do we have a skilled workforce shortage when we are at the lowest labor participation rate in ten years?

Work yet to be done on unemployment
Regulatory Hostility (more…)
by tradespeopleinsights | Feb 2, 2016 | Marketing Tools, Marketing Trends, Social Marketing, Traditional Marketing
By John Sonnhalter, Rainmaker Journeyman, Sonnhalter
As manufacturers we all know how important keeping in contact with our customers is. Email is one of the easiest and most effective way to do that and unfortunately for those of you who sell through a distribution process it’s hard to get the ultimate end user’s name no less try to start a relationship with them.
That’s why it’s important to begin building your own database of both current and potential contractors. If you’re fortunate enough to make products that require a warranty card that certainly is a place to start. Other outbound marketing activities should include incentives for contractors to give up their contact info so you can start a dialog with them.
Give them something of value that would help them in their everyday activities, such as:
- mobile app
- some sort of calculator to help them estimate projects
- white paper
- a series of how-to videos
- industry research on new and upcoming trends
- checklists on detailed processes
- case study
- tool kit (cheat sheets, checklists, videos, e-books)
Do you know that the average office worker checks their email 30 times an hour? Can you imagine what the stats are for contractors out in the field?
The point is that emails are very acceptable ways of communicating with each other. The key is to have relevant and timely info for your prospect.
Heidi Cohen gives us several reasons why email trumps social media:
- Email provides directly measurable ROI – You know immediately how many opened and read your message.
- Email is content format agnostic – It’s user-friendly and you can use text, images, videos, audio, PDFs.
- Email can deliver both long and short content – Content can vary from a link to several pages in length.
- You can control delivery of emails – Whether it’s now or delayed.
- Emails can be read on anything – Smart phones, tablets, laptops, no apps required.
- Emails build customer relationships – Once someone allows you to communicate with them, it represents a certain level of trust.
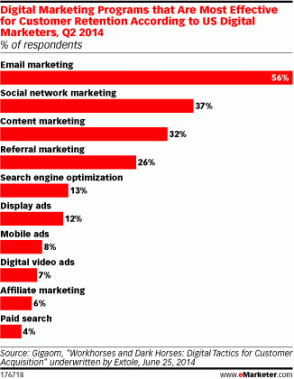
With all the marketing trends and new things over the last several years, email still seems to be the “workhorse” for most people’s marketing efforts. Recent research from Gigaom reports that over 75% of smart phone users check their emails on their phones. What I find remarkable, if you look at the chart below, 5 years ago paid search, SEO and digital ads would have been at the top of the list. Oh, how the more things change, the more they remain the same.
So what are you doing to grow your own email list?
Here are some other posts you might find useful:
Benchmark Report on Email Marketing Sheds Light on Top Priorities for B-to-B Marketers
5 Tips on Improving Your Email Marketing to Professional Tradesmen
Email Marketing: How Are You Using it to Reach the Professional Tradesmen
by tradespeopleinsights | Jan 27, 2016 | Public Relations
By Rachel Kerstetter, PR Architect, Sonnhalter
 Sonnhalter has used several services for a very long time… as in decades. I’m not sure how we started working with these services, but I had to assume there was a reason.
However when I took over the contracts with these services, no one seemed eager to provide the most important service of all… customer service. Coming into my new role, I wanted to understand our various contracts so I reached out to the most recent person assigned to us. No answer. I reached out to the company referencing our account number. No answer.
I attended a conference and visited the service provider’s table, and immediately got attention because they thought I was a new customer. The sales person apologized up and down and said our rep would be in contact with me. He was able to look up answers to some of my questions. More than a week after the conference, I had no contact.
When it comes to your customers, it’s crucial not to become lazy. Don’t expect your relationship to maintain itself just because you’ve been with them for years. Don’t focus all of your time and attention trying to win new business that you forget your current business.
As I learned in Marketing 101 in college, it’s cheaper to maintain an existing customer relationship than to build a new one.
When you ignore, forget or don’t serve your current customers the way that you should, you are in danger of losing them.
At the conference I met with several competing service providers who would be happy to have me as a customer, what makes our current providers think we’ll stick with them if there’s someone else who isn’t lazy?
In your personal life, if you were to call your mechanic for general maintenance on your car and they never called you back to schedule an appointment, you’d probably consider finding a new mechanic, right? It’s the same in the business-to-business world.
Your customers want to be valued, whether they’ve been working with you 5 days or 50 years.
by tradespeopleinsights | Jan 26, 2016 | Social Marketing
Today, we have guest post from Jeff Guritza, a marketing professional in the power tools accessories industry, on the incorporation of social media in a company’s business plan.
 We’ve all heard the term “social media,” and you may have even been afraid to ask, “What the heck is that?!” Regardless of your awareness level, you shouldn’t be asking yourself if your business should be engaged in social media. You should be asking yourself how.
Practically overnight, social media has become a cultural phenomenon. Simply stated, social media is defined as people going online to find, read or share content that interests them. Commonly used platforms are Facebook, Twitter, YouTube and LinkedIn. Contrary to popular opinion, it’s not just a personal platform that millennials use during their free time. Increasingly, people of all ages and nationalities jump online 24/7 for practically everything: researching gift ideas, sharing photos, reviewing products or getting directions
Social media is not a fad that will fade in time. Like your morning cup of coffee, it’s here to stay.
Social media transcends personal opinions, pastimes and hobbies. Its vast influence is felt in industries both large and small, near and far. Baby Boomers are embracing social media in droves, looking to communicate with grandkids and reconnect with friends. Whether you like it, people right now are vetting your business based upon content they find about you online.
To help guide you, here’s three smart steps to follow when looking to jumpstart your company’s social media engagement.
1. Social Media Lite: First, realize in this day and age you absolutely must have a social media presence. At a bare minimum, your company should set up accounts on LinkedIn, Facebook and Twitter. To do so, find your most tech- savvy associate and have him or her get online with a logo, some pictures, key contact information, company facts and reasons for being (think elevator pitch.)
This first step is non-negotiable and must be done ASAP. If you don’t have capable internal resources, it is worth the investment to have an outside vendor handle this on your behalf. Just ensure they share all account info (user names and passwords) to enable you to self-manage your accounts in perpetuity. This step isn’t expensive, complicated or even time-intensive. People are already forming opinions about your organization and likely sharing them online. As any PR counselor will tell you, it’s important to control the message, and having a social media presence is a way to accomplish this. This first step truly is the baseline cost of doing business today.
2. Define Your Brand: Step two focuses on building online content within the framework established in step one so that you’re engaging social media in a timely and purposeful way. From new product launches and success stories, to employee service anniversaries and customer awards, there’s plenty of content that industrial businesses can post.
And you should post. Many of your stakeholders find value in the content shared. Social media is a powerful new channel-to-market primed for you to get your business noticed in a positive way. And with step two, you’ve now taken what was a simple online presence and launched a bonafide program.
A valuable byproduct of this second step is tangible ROI. Like most online efforts, you’ll be able to track and quantify all activity (number of visitors, page “likes”, etc.) This is powerful data to capture and analyze to help guide strategic planning. It’s good to know what your target audience and stakeholders think about you and your company, warts and all.
With step two complete, you’ve effectively created an online measurable forum for people (customers, vendors, former employees, etc.) to engage with your organization on a personal, yet professional, level where they can provide feedback, ask for technical support and provide critiques that ultimately reflects how your company (brand, associates, policies, service levels, prices) is perceived by the market.
3. Establish A Process: (a rare final step today within the industrial distribution realm) is creating a daily, strategic online content management system. This only happens when you commit a dedicated resource (FTE) to reinforce and grow your brand in meaningful ways each and every day via social media.
This final step follows a structured, formal daily process to engage your company’s online audience by posting content that positions your company as the best in breed. This includes content from your team on best practices, helpful hints and upcoming trade shows and events.
Great content is king. Post anything that you consider valuable. This includes how-to videos, conversion charts, technical specs, best practices, success stories, etc. The goal is consistent, quality content that is aligned with your brand’s promise.
Make no mistake. Companies that have embraced step three can directly attribute business success (leads, sales, VOC improvements, etc.) to the social media process. Therefore, social media is making them money.
With step three, your social media function is now part of the expected, daily workflow and has become an integral component of your overall, multi-faceted marketing plan.
All industrial businesses must be present online in some formal fashion or you risk being viewed as outdated or even irrelevant. It’s like choosing not to travel to an industry event you’ve attended for years or forgoing an annual display ad in a trade publication. You become conspicuous by your absence. Forgo social media, and you’ll be viewed differently.
A fully operational social media process at your organization will allow you to educate, engage and convert readers into leads. And you will close more business (direct sales) because of your social media program.
Keep in mind it’s not an overnight process; it’s brand-building. And like Rome, it wasn’t built in a day.
The granular nature of online audience segmentation allows surgical strikes to an audience of one, a concept previously unattainable with traditional media.
People do business with people. And social media is people. This isn’t a lifeless magazine ad or a direct mail postcard; social media is one person’s thoughts, opinions and perception of your business. In this manner, it affords you the chance to identify opportunities and seize upon them.
As the information age continues to advance at a seemingly ever-increasing pace, any perceived lack of presence online is to your company’s detriment. Do yourself a favor now and invest the time to establish a baseline social media profile for your business. It’ll help attract land and retain customers, vendors and employees. You’ll thank me later.
Jeff Guritza is an international sales and marketing professional with more than 20 years of experience working for both manufacturers and distributors within several industrial markets: power transmission, fluid power and power tool accessories. This post originally appeared on Industrial Distribution.
by tradespeopleinsights | Jan 20, 2016 | Marketing Tips, Marketing Tools
By John Sonnhalter, Rainmaker Journeyman, Sonnhalter
As we start 2016, it may be time to reflect on ways we can do better moving forward. I have found one of the biggest issues and one of the easiest ones to correct is communications between sales and marketing. Here’s a post I did last year that might give you some starting points.
Sales and marketing must work together to define the ideal client and determine how and what to get in front of them. Social media and the internet in general has changed the way people buy. Today, research is done online long before the potential customer identifies themselves to a prospective vendor. So what can you do to ensure that when the buyer is ready, you’re on the list to talk to?
This is an issue that continues to frustrate marketers and sales across the board. Both disciplines have insights to offer and neither should be working in a vacuum.I read an interesting article recently by John Jantsch from Duct Tape Marketing that addresses this very problem.
He states: “My take is that for organizations to take full advantage of the dramatic shift in the way people and organizations buy today they must intentionally blend inbound marketing, outbound marketing and inbound selling a way that mirrors today’s customer journey.”
He offers some suggestions on how they can work together. Here are some highlights of shared responsibilities:
- Planning – When marketing is creating a plan, involve sales. They have insights that marketing doesn’t. Their insights are invaluable in helping define the customer journey.
- Editorial – Even if sales people aren’t great writers, they certainly can identify pain points along the way and possible solutions for marketing to write about.
- Social – Make sales aware of social opportunities, whether it’s LinkedIn or participating in an industry forum that social is a good networking tool.
- Engagement – Have sales and marketing make calls together or write a proposal.
- Measurement – Forget quantity and focus on quality of lead and how you can take them down the sales funnel. Focus on creating a profitable customer.
If you liked this post you might like:
Are You Getting Your Sales Force Involved in Social Media?
How Does Social Media Impact a B-to-B Purchase?
by tradespeopleinsights | Jan 19, 2016 | Marketing Tips, Marketing Trends, Uncategorized
By John Sonnhalter, Rainmaker Journeyman, Sonnhalter
According to a recent post in eMarketer.com, mobile is continuing to grow in the workplace. In 2014, the average non voice time U.S. adults spent on mobile devices surpassed that of desktops and laptops for the first time.
And by 2017, eMarketer.com estimates that mobile usage will increase to more than an hour a day more than desktops or laptops. This should come as no surprise to us. The next time you’re in a meeting, look around the room and see how many mobile devices are there and how many times those individuals check their devices during the course of the meeting.
So what does this mean for manufacturers who are trying to reach the professional tradesman? It means if you don’t currently have a mobile strategy, you better develop one soon! Here some areas you need to focus on:

LinkedIn, a leading BtoB social media tool, reports that 55% of all its traffic is coming from mobile in the last part of 2015. Google reported that in the U.S., more than 50% of all searches were made on mobile devices .
Similar estimates for mobile use: Facebook (58%) and Twitter (90%) are forecasted by the end of 2016.
Mobile is here to stay and we need to recognize that these are new challenges for our workforces.
